
Chart update 05/01/17
| Mar 2017 | Feb 2017 | Mar 2016 | |
| Southern CA | 22,000 | 14,900 | 38,000 |
| Northern CA |
17,800
|
12,700
|
17,600 |
|
CA Total |
39,900 | 27,700 | 38,000 |
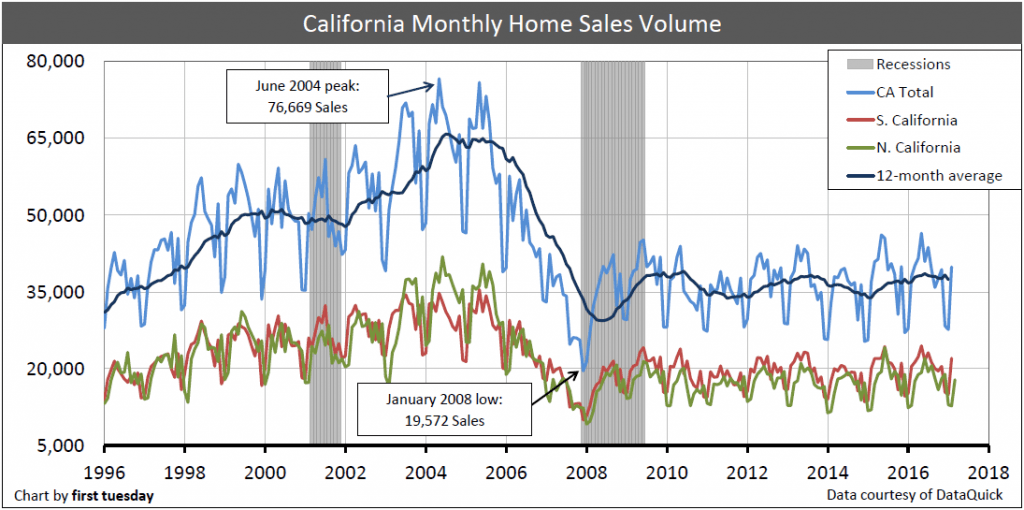
The above chart tracks the home sales volume of single family residences (SFRs) on a month-to-month basis. Sales volume includes the sale of all residential resales and new homes in California, including new homes sold directly by builders.
Home sales vary from month-to-month for a variety of reasons, most significant being homebuyer demand. This demand is influenced by several factors constantly at work in California’s homebuying market.